Mo Zhou Mechanical Engineering · University of Toronto
Projects/RC Aircraft Program/Jul – Aug 2026

Optimizer

An optimizer built on AeroSandbox that optimizes geometry, mass and trim together against a specific mission.

Built withPython · AeroSandbox · CasADi · Claude Code
StatusSet the v2 configuration
SourceOptimizer ↗
Why

RC v1 was drawn by hand and ended up too heavy. The obvious step would be to make v2 lighter, but that does not address the core of the issue, which is that the plane was never sized. Span, chord, tail, battery placements etc. were chosen on their own, but nothing checked the whole plane with all of the individual components together.

These components influence each other. A larger wing creates more lift at the cost of weight, and it moves the centre of gravity as well. Meeting a mission requirement means balancing all of it at once, which is what this program was written to do.

The optimizer solves the aerodynamics with a lifting-line model rather than full CFD, and optimizes geometry, mass and where that mass sits, propulsion and energy, and the constraints that come from manufacturing. It then optimizes the aircraft against a specific target, whether that is flight time, range or speed, rather than against a stand-in like L/D. For RC v2 that target was endurance, so every number on this page is the answer to the question of how long the aircraft can stay in the air.

How it was built

This program was developed with the help of Claude Code. I did not want to, nor had the skills to, build an actual lifting-line model, so from the start this project was going to be a shell put on top of aerodynamics software. AeroSandbox was chosen over similar software like XFLR5 mainly because its API is easier to use, and because it works well with the structure of the app, which runs until a design converges.

The general workflow with Claude is the following, and each stage is its own document inside the repo. First, the idea and formulation: what the tool might look like, the programming language, and the choice of AeroSandbox. Then the per module equations and where their data comes from. Each module is given a contract of what goes in and what comes out, and every constant is traced back to a source. The propeller comes from published APC performance data fitted as smooth curves. The motor is an equivalent circuit built from its vendor Kv, resistance and no load current. The battery is held at discharge average voltage rather than full charge. The printed structure is split into skin, ribs and joints with calibrated constants. Anything doubtful is labelled as such in that document. Next is the code structure and milestones, as well as a sample aircraft to calibrate the whole project. Then implementation is done mostly automatically by Claude Code based on the specs written.

Each milestone had an explicit gate and a goal that had to be met, which broke the project into smaller testable pieces. Milestone 1, for instance, shipped with no optimizer at all: geometry, mass, CG, aerodynamics and propulsion, all evaluated on one fixed design. For M1 to count as complete, those numbers had to land inside plausibility bands built from published data on real comparable aircraft, among them an X-UAV Mini Talon, a solar sailplane and two Eclipson printed designs.

Despite working with testable milestones, there was still a lesson to learn here. The problem with AI agents is not that the code fails, it is that the code produces a plausible result which never gets properly checked. Three separate issues came out of this, with the propeller, the winglet and the warm start. None of them were caught by a test suite. They were found because every run is written out as a self-contained artifact, with its inputs and measurements stored beside the result, so eventually each number ran into something further down the line that disagreed with it.
The First Optimized Design

The first working version of the optimizer evaluated a fixed design (a starting point) with all of its components, spars, masses and the rest, and reported a value for endurance. After this it is the exact same pipeline, but now with an optimizer that generates a complete aircraft from a set of about fifty design variables representing span, chord, taper and so on.

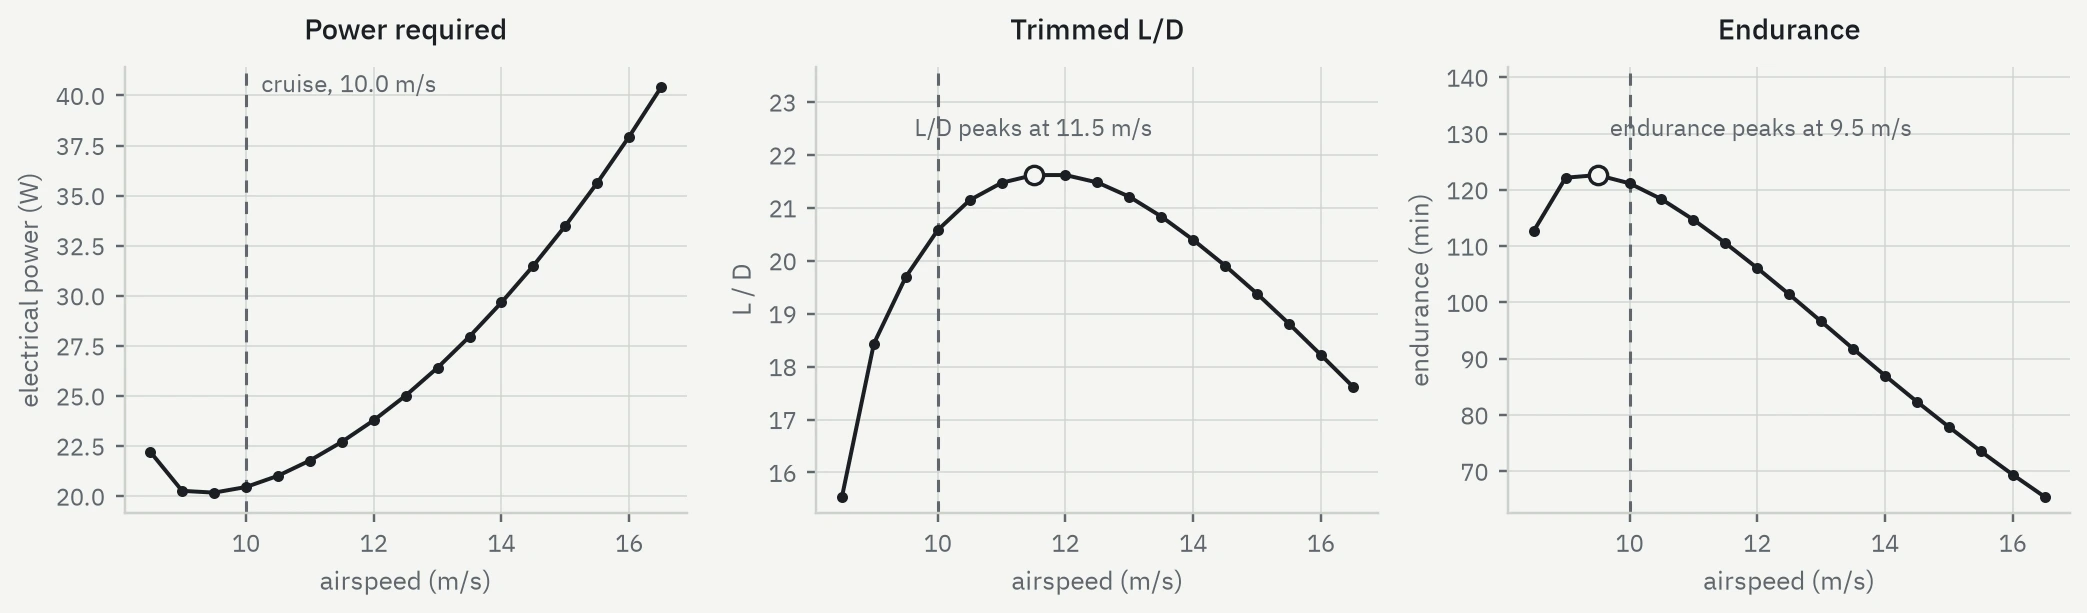
The refusal to optimize a stand-in pays off immediately here. L/D, commonly associated with efficiency and endurance, peaks at a speed of 11.5 m/s. The optimizer, however, measured endurance peaking at 9.5. The difference is electrical rather than aerodynamic, because what drains the battery is watts, and the propeller and motor both change efficiency with speed. If the program had just used L/D, the plane would have flown close to 2 m/s too fast. The classical result that the best-endurance speed is slower than the best-glide speed was essentially discovered by the optimizer during the run, rather than being an assumption made before it.

Three plots against airspeed for the RC v2 design. Electrical power falls to a minimum near 9.5 m/s then climbs steeply. Trimmed L/D rises to a peak of about 21.6 at 11.5 m/s. Endurance peaks at about 123 minutes at 9.5 m/s and falls away to 65 minutes by 16.5 m/s. A dashed line marks the 10.0 m/s cruise on all three.
FigureThe final speed sweep for RC v2. Cruise sits at 10.0 m/s, to the right of the endurance peak, because that is where the aircraft is airworthy

Curved Planform

Early versions of the optimizer modelled the wing through a series of panels, each with its own chord ratio. However, this was too restrictive, both for the optimizer, because it can only move the corners of a shape, and for CAD, because the wing is then restricted to a series of lofted sections rather than a continuous wing.

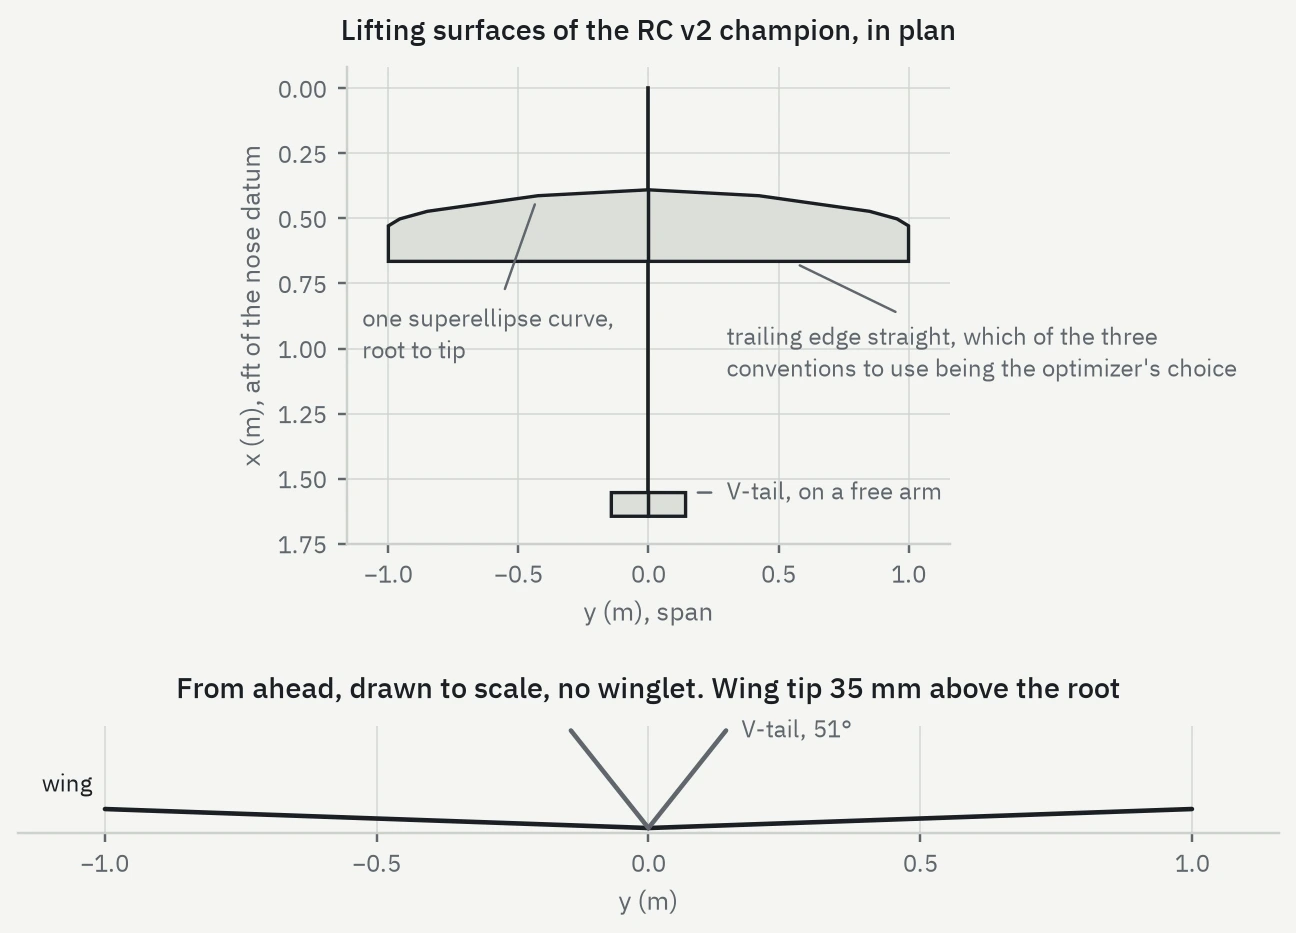
So the planform became a continuous superellipse whose exponent itself is a design variable. Furthermore, the leading edge convention became a variable as well. A wing is normally drawn off one straight reference line, because the spar is a straight tube, the control surfaces hinge along a straight line, and the joints between printed sections want something straight to sit against. Every wing in this family therefore has exactly one straight line running down its span, and the variable is simply where that line sits as a fraction of the chord. At zero it is the leading edge, at one the trailing edge, and anywhere in between it is a line inside the wing with both edges curving around it. On RC v2 that line settled on the trailing edge, even though the design spec the optimizer started from had asked for a straight leading edge.

The run then exports both the leading and trailing edge as curve files that import straight into SolidWorks, 201 points each, following the chord law rather than only the five stations the solver analysed. Those same curves feed the Airfoil Converter, whose wing tool takes them together with the exported sections and builds the wing the optimizer solved for inside SolidWorks.

Two plots of the RC v2 aircraft. In plan, the wing spans 2 m with a curved leading edge sweeping aft toward the tips and a perfectly straight trailing edge, with a small V-tail on a boom 1.5 m aft. Seen from ahead, the wing rises only gently from root to tip and carries no winglet, while the V-tail rises steeply from the same centreline at 51 degrees.
FigureThe RC v2 champion’s lifting surfaces, drawn from the run’s own geometry export

The Propeller

On the first run with a freed propeller through the optimizer, it came back at 123.5 minutes against the previous champion’s 112.5. The obvious reading was that the new wing is superior; taking a deeper look at the breakdown suggested the opposite. Lift to drag moved 1.2%, weight was within 2 g, but electrical power draw fell 10% (not something a wing can do). What actually changed was the propeller, whose efficiency went up 10.4%, accounting for the entire gain and leaving the wing as noise.

Investigating this further found the real defect. The fit ignored Reynolds number and averaged across a hardcoded RPM window, resulting in propeller efficiency being overstated by nearly 7%. This did not affect the ranking up to this point because the efficiency boost existed for every design, thus allowing the issue to go unnoticed. Any endurance figure from before this date is therefore not comparable with one after it.

The fix was to fit the propeller against blade Reynolds number as well, making the model work with propellers from 5 to 22 inches. This change allowed the entire published APC range to ship fitted, alongside the UIUC propeller database (661 tables in all, 218 of them wind-tunnel tested). However, trying a propeller requires re-optimizing the entire aircraft around it, so in practice the true list is device and time limited.

A screening pass was therefore made so that the propeller can be chosen from the entire catalogue. The airframe and operating point are held fixed, while only the propeller, motor and ESC are re-solved for each candidate. It produces a shortlist of the leading four that will go through a full solve. Testing this against an earlier study whose answer was already known (it had spent 40 minutes on eight full re-solves), the screen ranked 65 candidates in half a second and put the same propeller first.

What it produced

The optimizer’s final output was a configuration for RC v2. The generated section curves go from here into the Airfoil Converter and on into SolidWorks.

Span2.00 m
Wing area0.464 m²
Aspect ratio8.6
All-up weight2.10 kg
Cruise10.0 m/s
Cruise power20.5 W
Trimmed L/D20.6
Endurance121.2 min
VideoA few hundred iterates of the RC v2 champion run, each one a complete aeroplane
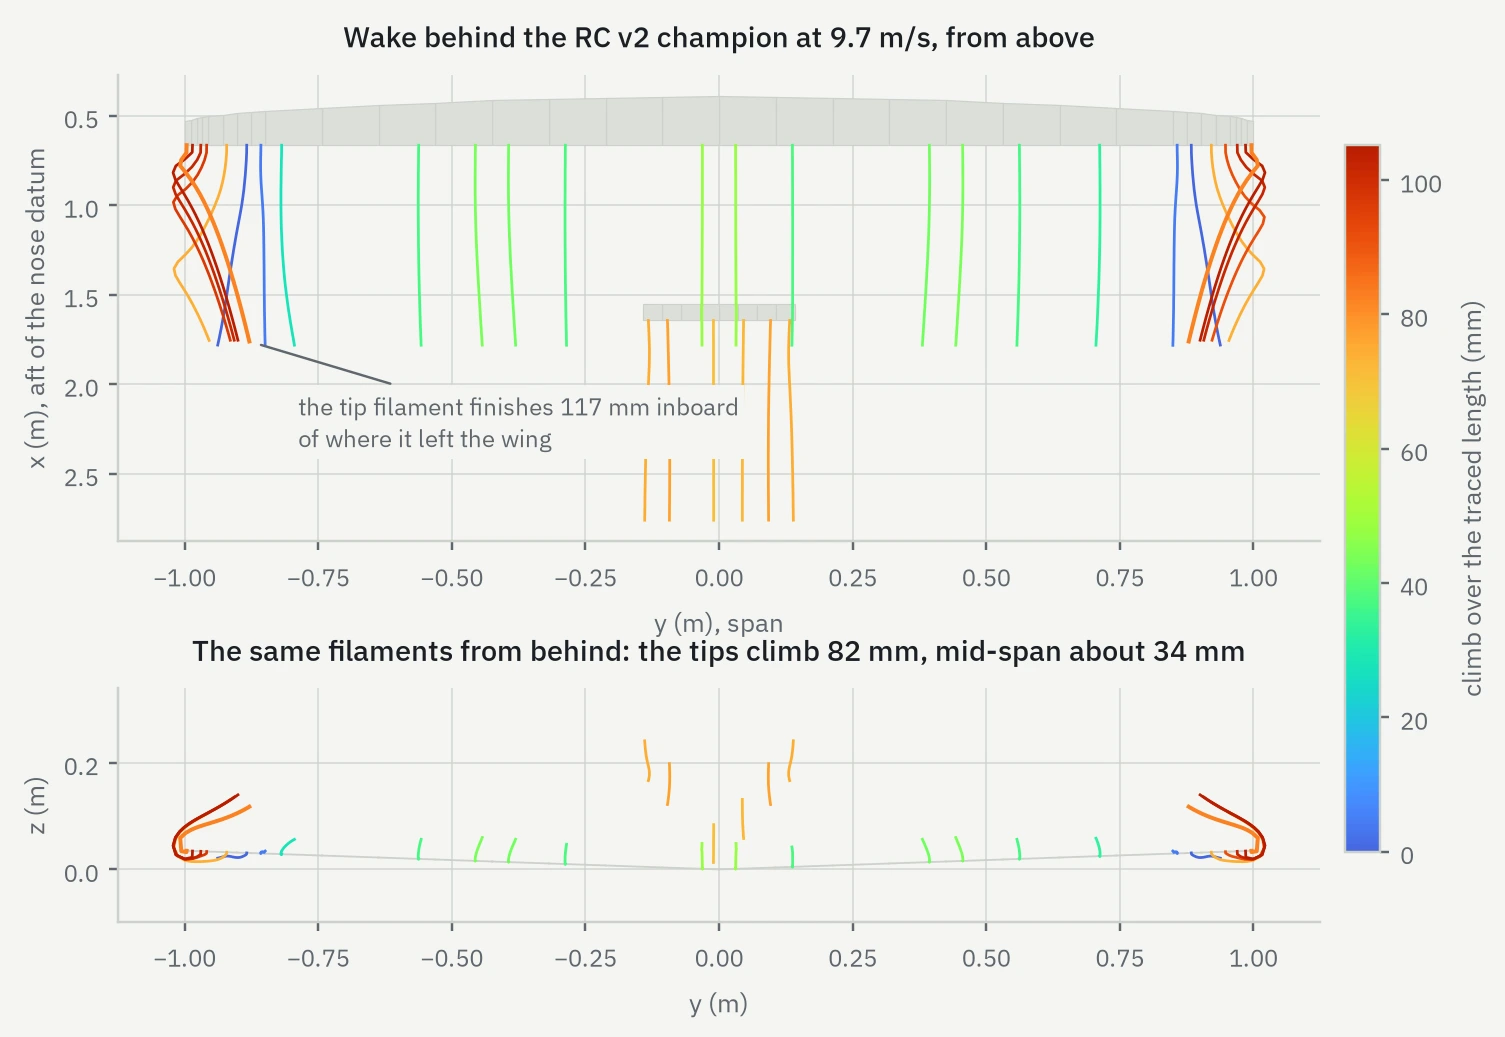
Two panels of the champion’s wake at 9.7 m/s, the filaments coloured by how far each one climbs on the optimizer’s own blue-to-red scale. Seen from above, they trail aft from the wing and V-tail; the outermost pair, in deep red, curve inboard and bunch together near the tips, while blue and green filaments inboard run almost straight. Seen from behind, the tip pair hook steeply upward and the mid-span ones barely rise.
FigureWake rolling up at the tips, traced through the induced field
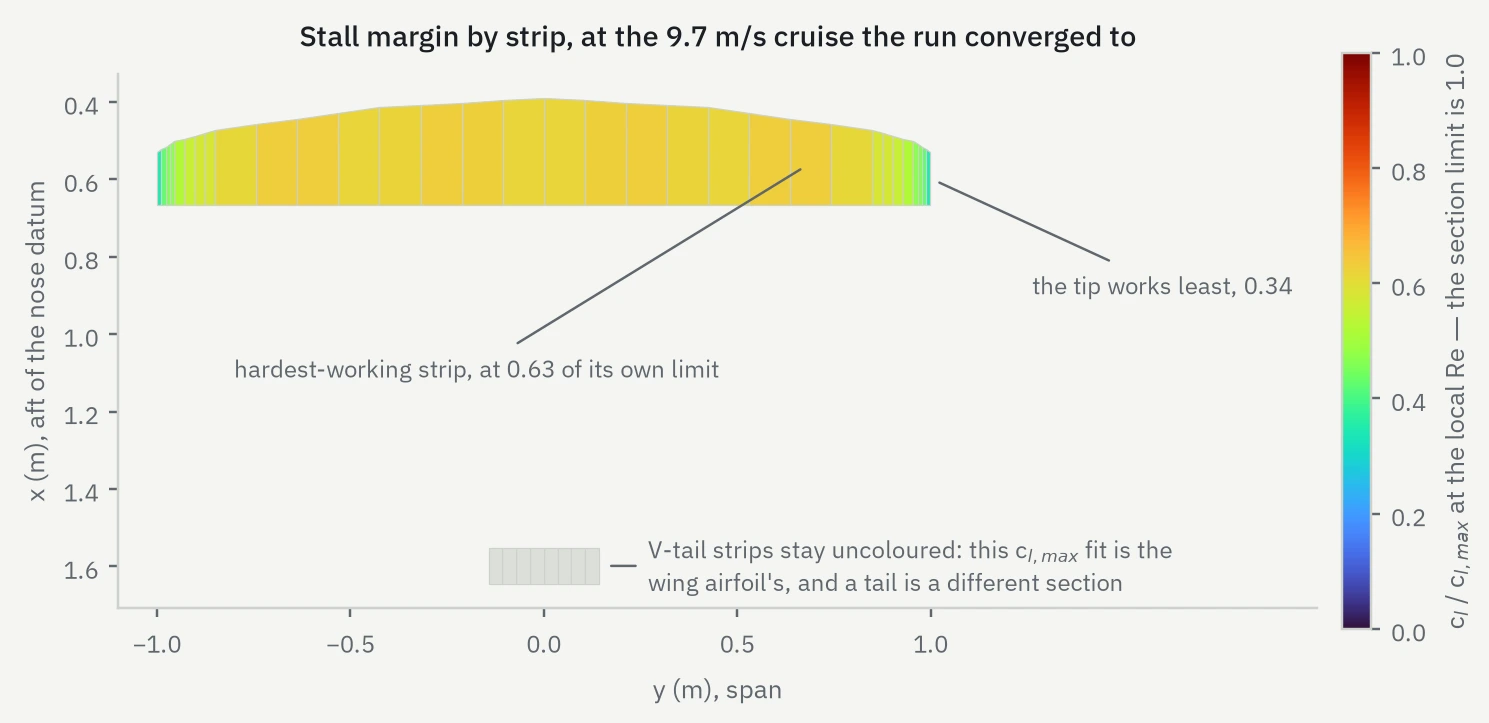
The champion’s planform with each wing strip coloured by its share of its own stall limit, on the optimizer’s blue-to-red scale running from zero to the limit. The wing sits in amber around 0.63 at its hardest-working strip inboard, falling to green at the tips, at 0.34; the red end of the scale is unused. The V-tail is drawn in grey, uncoloured.
FigureStall margin across the wing at cruise

The final design did not include a winglet because the study found it did not pay for its own predicted 42 g. Whether the other limits on the design paid for themselves was investigated the same way, by relaxing one constraint on its own, re-optimizing, then checking the endurance that came back. Removing the optional payload (the companion Pi, airspeed sensor and telemetry radio, 192 g) is worth 7.9 minutes and another 200 mm of span is worth 5.2, while everything else came in under a minute.

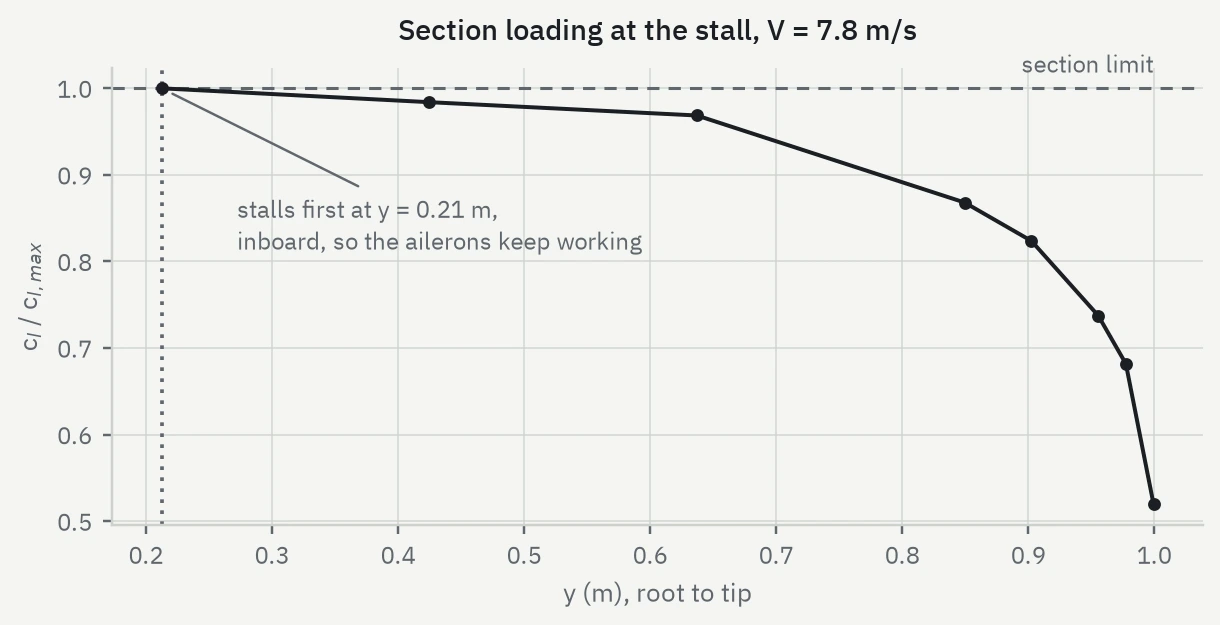
Furthermore, the stall behaviour is a constraint here rather than a result. It is enforced by each section checking against its own maximum lift coefficient at its own Reynolds number. Because the check is per section rather than wing-level, the optimizer can see exactly where the margin is thinnest and buy its stall behaviour in the cheapest way available. It chose chord at the tip over washout, so the wing carries no twist at all and still gives up at the root first, leaving the ailerons working when it does.

Section lift coefficient as a fraction of its maximum, plotted from wing root to tip at the stall. The curve starts at 1.0 at y = 0.21 m, just touching the dashed section limit, and falls away steadily to 0.52 at the tip.
FigureSection loading across the span at the stall
Next steps

There are a few things worth pointing out here. The profile that predicts printed mass from geometry is not yet calibrated against real weighed parts, and at this point in the project it cannot be: exactly how the wing for RC v2 will be gridded has not been decided. The propulsion chain is uncalibrated as well, so every figure quoted on this page is a ranking rather than a prediction.

The natural next step is therefore to design and build RC v2 from the results here, weigh it, and recalibrate the mass model against the real aircraft. After that, and assuming RC v2 flies, how accurate the model actually is can be tested for the first time.

Credits

The shared CasADi lifting-line function and the solver warm-start work came from Ethan, and cut the peak memory of a solve by about half without moving the answer, verified to fifteen decimal places before it was merged.

↑ RC Aircraft Program